Analytics buzzwords that continue to be of import:
5) Predictive & Prescriptive Analytics
10) Natural Language Processing (NLP)
Curious to learn more? Check out the full article.
Analytics buzzwords that continue to be of import:
5) Predictive & Prescriptive Analytics
10) Natural Language Processing (NLP)
Curious to learn more? Check out the full article.
Rich data is only as useful as people’s access to it. In the enterprise, legacy databases are the norm. Problems arise, however, when considering how to grant secure access to the data, as well as how to make the data relevant to the user.
One solution to the accessibility and usability of data is to turn to the web to serve as a secure conduit, making the data accessible to users who do not have easy access to it. As the data access needs of geographically dispersed staff are considered, for example, it becomes clear that a data-driven web application can be the solution. Delivery of data via a web application provides:
Comparative data, or trending data, can be visualized through infographics: using interactive graphs, charts and other imagery to help data ‘come to life’ for the viewer.
You know the feeling – the realization that your latest web project is suddenly off course. The development schedule is slipping and budget overages are on the horizon. The likely culprit is the identification of one or more new requirements that management or the client determines are a priority. Whether the project is an enterprise web solution or a simple web app, the introduction of new requirements once development is well underway is almost always detrimental, causing slipping schedules and skyrocketing costs. In the worst case scenario, business is disrupted, users are frustrated and goals are not realized. As reported by Forbes magazine, “25 percent of technology projects fail outright; 20 to 25 percent don’t show any return on investment; and as much as 50 percent need massive reworking by the time they’re finished.”
According to Information Age, “An expanding project may lead to development going vastly over budget, and can continue to cost, even past the go-live date. A noticeable sign of this issue is ‘scope creep’, where requirements are constantly added to the initial specification without the project’s budget, timescales or functionality being updated accordingly.”
A proven approach to help avoid this scenario is to start each web project with a discovery phase. By completing discovery, the project team is in a better position to architect and implement a solution that successfully addresses critical business, user and technical requirements. From my experience managing large scale web projects, I’ve learned that traditional ‘requirements analysis’ processes, such as the waterfall method, are not necessarily the most effective approach. Instead, let’s consider a more contemporary, “lean” or agile approach to gathering and finalizing project requirements.
In an agile development environment, being responsive to change is expected. However, this is not the same thing as starting a project EXPECTING to have changes based on the identification of new requirements. All projects benefit from the expectation that a strong effort has been made to finalize requirements before development begins. The goal is to achieve a balance between the time/effort/cost of a traditional requirements analysis phase that aims to identify ALL requirements before development begins, and a leaner, more streamlined process that will identify critical requirements, but may not delve as deep to refine more obscure requirements. The agile development process will compensate to address the less critical requirements that are identified after development has begun.
Let’s review some examples of a leaner discovery approach. At a very high level, this approach is less about creating a formal requirements document, and more focused on direct user interaction to solicit feedback:
“We don’t have the time or money for that.” Even this suggested scaled back discovery approach impacts project budget and schedule. However, the insight that is gained becomes a critical component of a successful project. In fact, a properly completed discovery typically results in a project actually meeting its budget and schedule parameters. And implementing the leaner requirements approach will have less of a budget and schedule impact.
The discovery process can be completed solely by an in-house team, in tandem with an outside consultant, or 100% outsourced. In my experience, all three scenarios can be effective. If, however, there is an internal environment where different factions are competing for control of the project, using an outside consultant may be more beneficial, resulting in a more subjective analysis.
So the take-away is: include a lean requirements phase to increase the probability of a successful web project launch!
Your website isn’t “Field of Dreams”…..if you build it, they may not come. Methodical work to promote your site and make it search engine friendly pays off with high rankings on Google.
But what if Google isn’t giving your site the rankings you expect? Google admits to making hundreds of updates to their search algorithms each year, often to reduce fraud and “gaming the system.” The company’s goal is to provide the absolute best search experience for their users so they are constantly refining.
Occasionally, Google actually announces algorithm changes in order to educate website owners to be proactive to improve their site. There are two initiatives in particular that Google has been upfront in promoting, announcing that sites will be negatively impacted if:
So what does this mean for your website? First, make sure your site has an SSL (secure socket layer) certificate. SSL encrypts all communications while in transit. The Chrome web browser has begun to prominently flag websites that do not use the HTTPS protocol. This is low hanging fruit – it’s easy – get your IT group or web development partner to buy and install an SSL certificate. For more information on Google’s approach, read this article.
Second, it’s strongly suggested that you make sure your website is responsive, meaning it works gracefully on all devices. Google’s goal is to effectively serve ALL users, regardless of the device they are using to access the web. This means that Google will identify a site as “less relevant” if it is determined that a user can’t have a good experience if trying to view the site on a smartphone. This one is a bit more involved to resolve. Sometimes an existing site can be optimized for display on smartphones. Other older sites may require a website re-design. Speak to your internal marketing group or a trusted web design and development firm for advice.
Paying attention to these two issues will go a long way towards earning Google’s love.
Google took a giant step towards helping organizations get the most out of their data. Using an existing data source, such as Google Analytics or multiple spreadsheets, the new web-based Google Data Studio makes it possible to create interactive visualizations of data that can be easily shared. The streamlined process really is as easy as 1-2-3:
All data has a story to tell. The challenge is how to bring that story to life in an impactful, yet cost-effective manner. Stories are to be shared and Google Data Studio is the tool that can help:
Once a report is done, share it via static PDF or grant permission to colleagues to view and edit the report via the Google Data Studio dashboard. Authorized colleagues can collaborate on the report real-time, such as changing the date range of the report to track data trends.
The Google Data Studio design and development team delivered in terms of launching an intuitive tool that is flexible for those users who want more, such as:
The bottom line is that Google Data Studio may help your organization get more value from your data. Still in beta, it is expected that Google will continue to add features and functionality. For example, the tool does not currently support the import of behavior flow graphs from Google Analytics.
So give Google Data Studio a test drive to see if your organization can reap its benefits. There are numerous options for learning to use Google Data Studio or reach out to a consultant to help you get started.
Over the past several years, web application security has come to the forefront for software developers. Where in the past, terms such as “SQL injection” and “cross-site scripting” where completely foreign, most professional web developers now have at least a basic understanding of what these vulnerabilities are and the risks that they pose.
In addition, education and tools have become more readily available, along with techniques and best practices for developers of web applications.
However, in spite of the resources available and knowledge gained, adopting web application security best practices is still a difficult process. Here are a few reasons why:
With the list above, it may seem that the security challenge is insurmountable, particularly for resource constrained organizations. However, all is not lost, and there are a number of basic but effective techniques that can be utilized to reduce the vulnerabilities that are exposing your data. I would call this the “low hanging fruit” of web application security:
Has all the talk about the significance of “big data” left your company stymied about where to start?
At the 10,000 foot level, we turn to data, big or small, to help inform our business decisions. Where should research dollars be spent? Which marketing campaigns are having an impact? Do we have a clear understanding of our company’s competitive advantage?
These questions can be informed by analyzing “little data”. Think of little data as “small dose” data. Little nuggets of gold that we likely already have at our fingertips via data analytics, legacy databases, or possibly government managed, public data sets.
But whatever the source of the “little data”, it’s significance will partly be determined based upon how that data is shared. Simply having access to the data does not provide value. You need to decide how best to make that data consumable by your audience, regardless of whether the audience is your executive management team, your sales team or current and potential clients.
Let’s take a look at some of the contemporary options for using the web to effectively share “little data” in ways that will help your organization capitalize on the data’s full value:
 combine data from more than one data source. This can be an effective way for an organization to enhance their internal data with complementary data from a different source. For example, for some of our biotech clients, we combine data from their internal sources with additional data from the Centers for Medicare and Medicaid Services.
The bottom line: determine if your organization has “little data” that isn’t being put to its best use. If so, it’s time to start strategizing about how you can capitalize on the data to support your organization’s short- and long-term goals.
You’ve heeded the warnings about the importance of getting your website or web application protected by an SSL certificate (if you’ve missed this recommendation, read this post). The next and final step is to update your Google accounts to reflect this change. It’s simple –update the Google Search Console and your Google Analytics account. Here’s how:
Google Search
Visit the Google Search Console. Set your primary domain to your https version, but make sure each of the following versions are added, as well:
For detailed instructions, see Google’s checklist.
Google Analytics
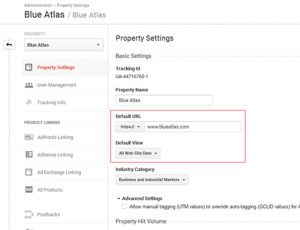
The last step is to change your domain in Google Analytics to https. By doing so, Google Analytics will recognize your site and continue to track your site data. Simply log into your Analytics account and navigate to manage/property settings. Update the “default url” to “https” and “default view” to “all website data”.
In response to numerous questions from clients regarding the actual differences between a website, a web application, and a mobile app, we thought a quick primer would be useful:
A website consists of static, manually-updated information.
A web application allows the user to interact with the web site, eg. to make a purchase, like PayPal or Amazon. A web application relies on a database for content and can be accessed from any device that has a web browser.
A mobile website is a website or web application that displays nicely on a mobile device. The site is accessed via the web browser of the device. You can still access some phone specific features, like calling a number from your phone or geo-location services.
A mobile application, sometimes referred to as a native application, is something you download onto your phone or device( via the Apple or Google Play store, for example) to perform a task or provide a function.
When deciding which approach, be sure to consider your specific business needs. If you primarily want to communicate a message, a mobile website may be the best first step.
A mobile app makes sense if you are targeting regular users, you want to offer them customization, you want them to be able to use the content offline, or the content requires complex calculations (ie. for gaming).
Since the cost of developing a mobile app is typically greater than that of a mobile website, consider if a mobile website will meet your business requirements, as compared to a mobile app.